pacman::p_load(GGally, parallelPlot, tidyverse)Hands on Exercise - Parallel plot
Load package and data
wh <- read_csv("data/WHData-2018.csv")Plot smiple parallel cordinates
ggparcoord(data = wh,
           columns = c(7:12))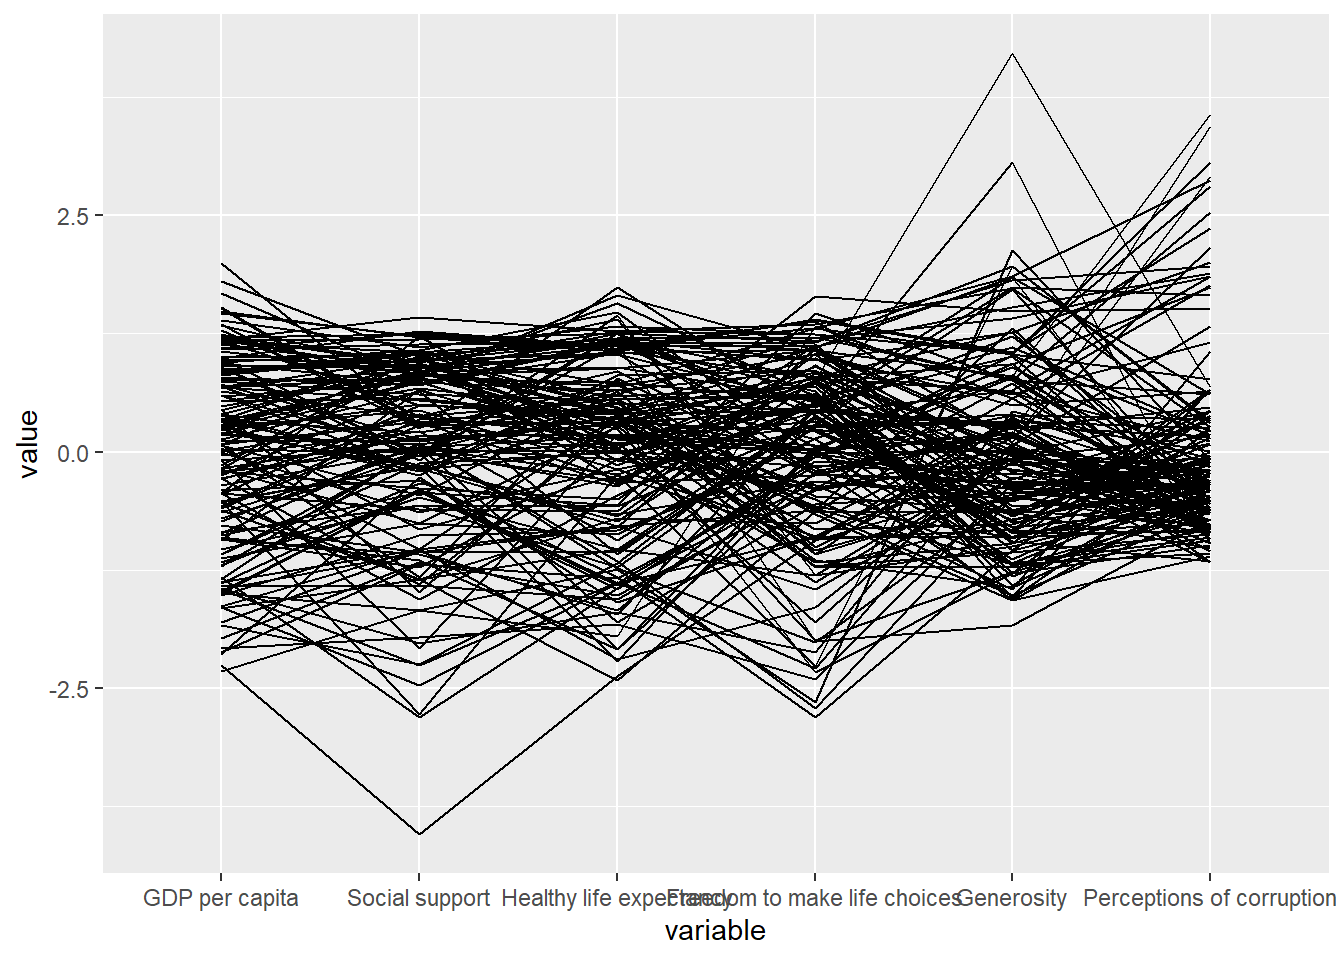
With Boxplot
ggparcoord(data = wh,
           columns = c(7:12),
           groupColumn = 2,
           scale = "uniminmax",
           alphaLines = 0.2,
           boxplot = TRUE,
           title = "Parallel Coordinates Plot of World Happines Variables")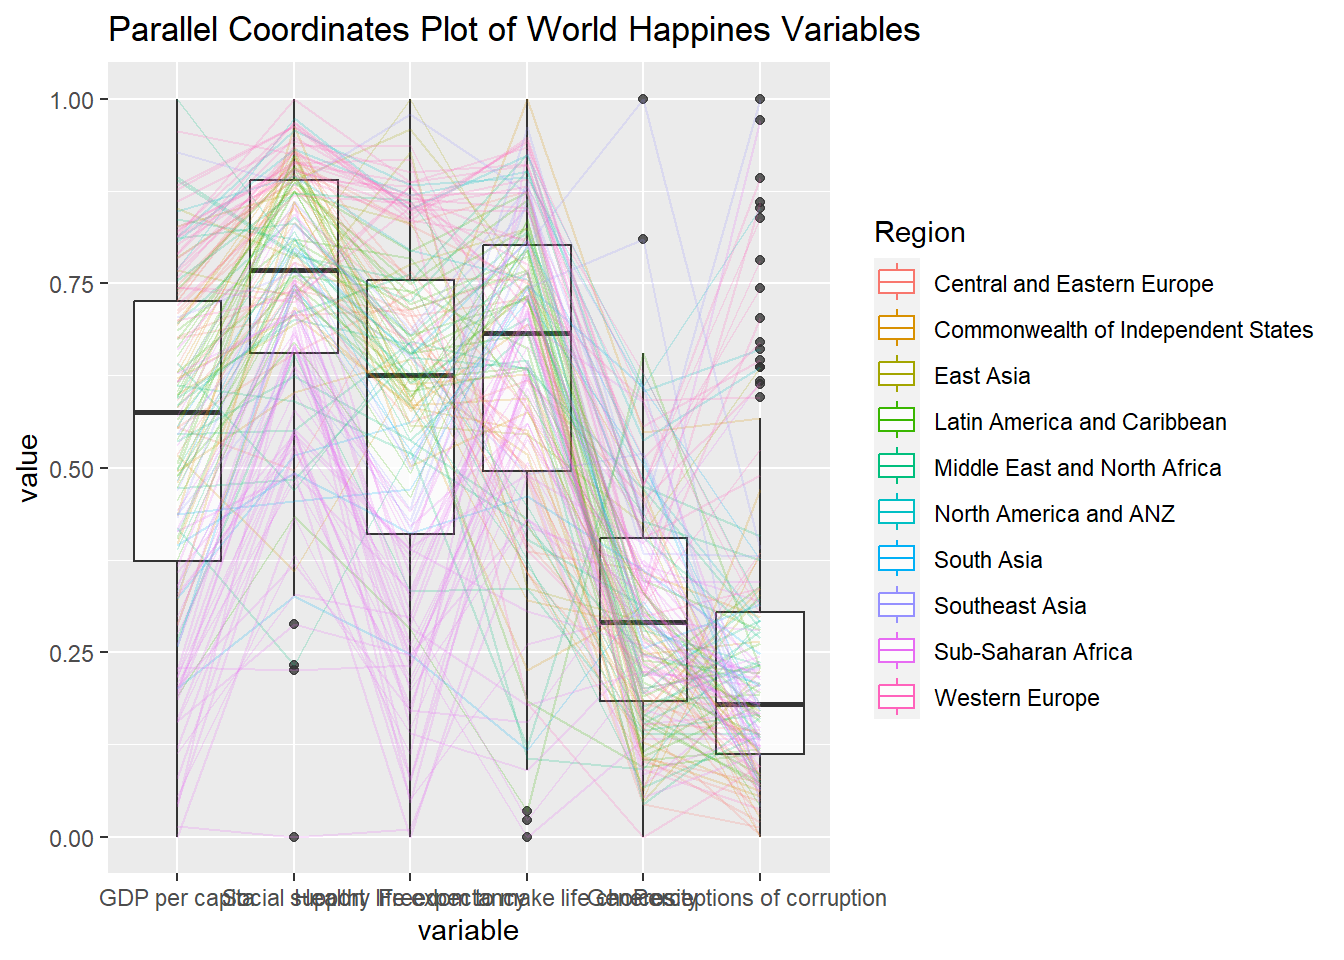
Facet
ggparcoord(data = wh,
           columns = c(7:12),
           groupColumn = 2,
           scale = "uniminmax",
           alphaLines = 0.2,
           boxplot = TRUE,
           title = "Multiple Parallel Coordinates Plots of World Happines Variables by Region") +
  facet_wrap(~ Region)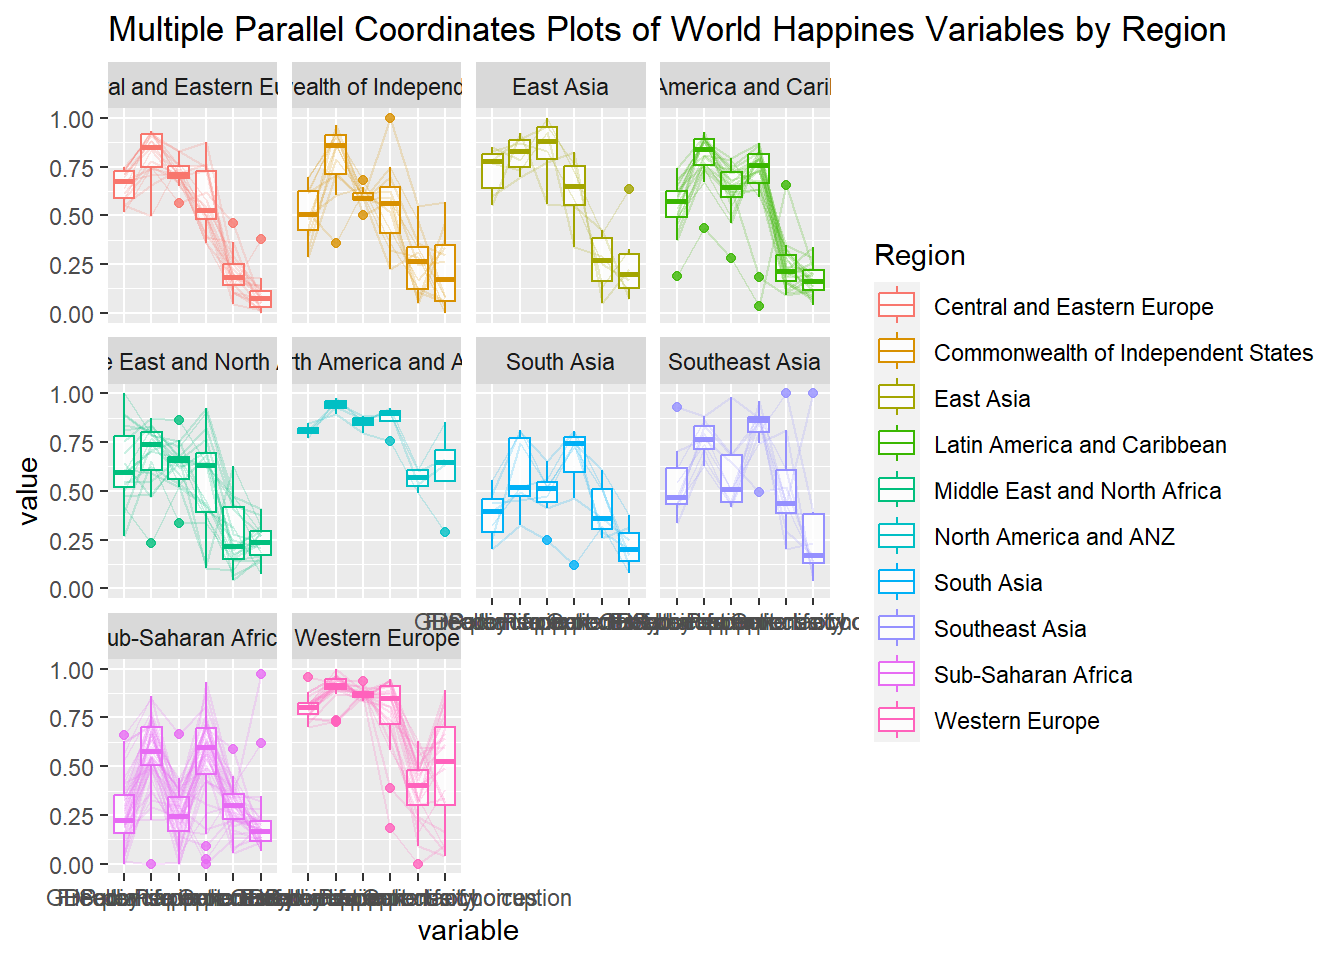
Rotating X axis text label with themes
ggparcoord(data = wh,
           columns = c(7:12),
           groupColumn = 2,
           scale = "uniminmax",
           alphaLines = 0.2,
           boxplot = TRUE,
           title = "Multiple Parallel Coordinates Plots of World Happines Variables by Region") +
  facet_wrap(~ Region) +
  theme(axis.text.x = element_text(angle = 30))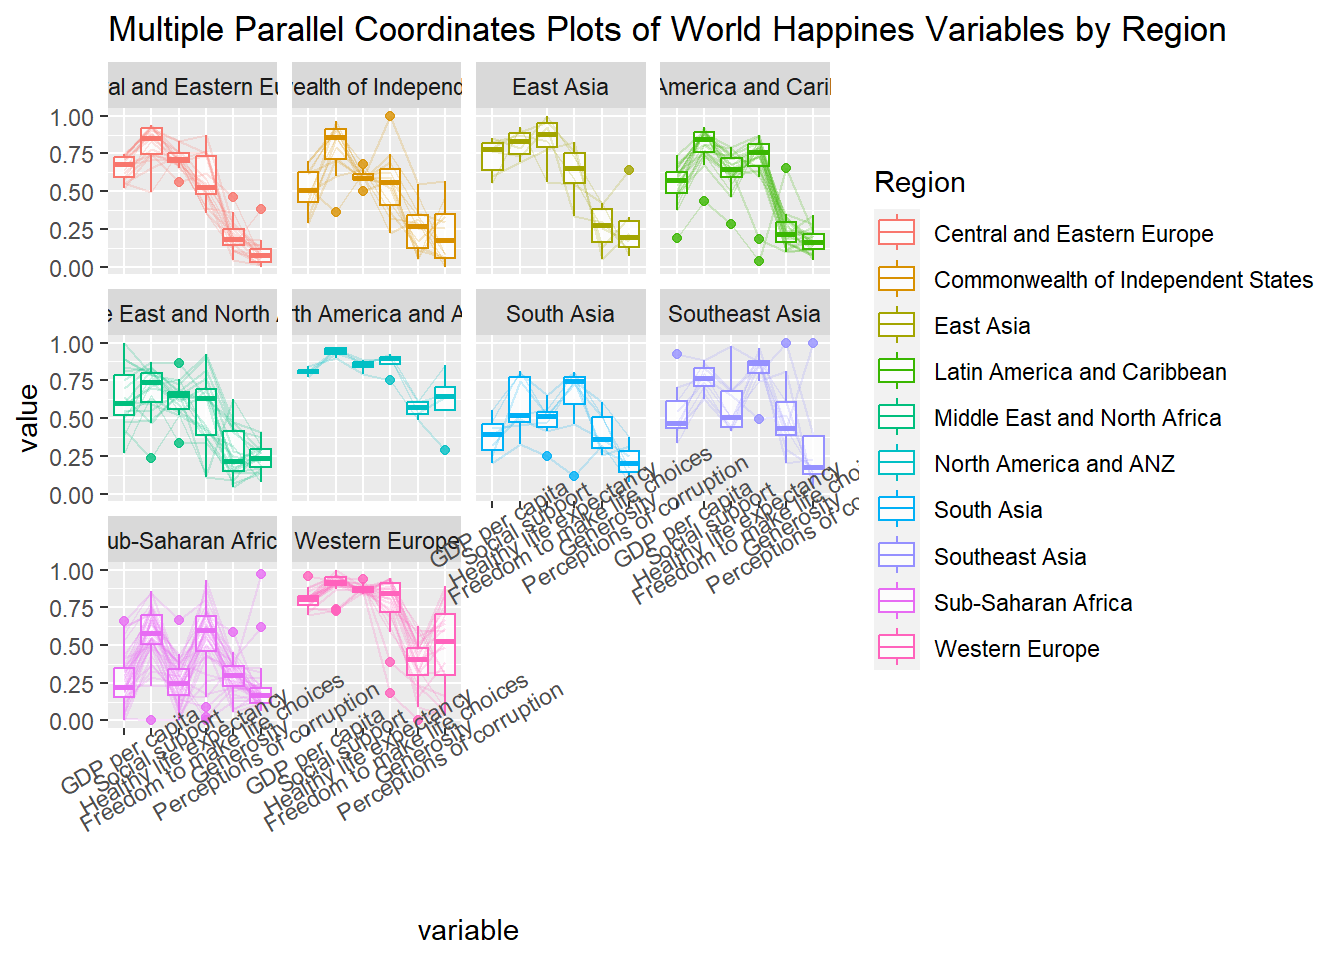
##Interactive
Basic plot - parallelPlot()
wh <- wh %>%
  select("Happiness score", c(7:12))
parallelPlot(wh,
             width = 320,
             height = 250)
Rotate axis label
parallelPlot(wh,
             rotateTitle = TRUE)
Parallel coordinates plot with histogram
histoVisibility <- rep(TRUE, ncol(wh))
parallelPlot(wh,
             rotateTitle = TRUE,
             histoVisibility = histoVisibility)